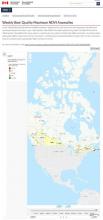
In the “Weekly Best-Quality Maximum-NDVI anomalies” dataset series, each pixel value corresponds to the difference (anomaly) between the mean n-year “Best-Quality” Max-NDVI of the week specified (e.g. Week 18, 2000-2014) and the “Best-Quality” Max-NDVI of the same week in a specific year (e.g. Week 18, 2014). Max-NDVI anomalies < 0 indicate where weekly Max-NDVI is lower than normal. Anomalies > 0 indicate where weekly Max-NDVI is higher than normal. Anomalies close to 0 indicate where weekly Max-NDVI is similar to normal.
For more information, visit: https://open.canada.ca/data/en/dataset/ea6b4be2-9826-47f3-a387-33ddf02592f4
Developed by
Agriculture and Agri-Food Canada
Subject
Device Formats
Web
Date Published
August 14, 2017
Keywords
- agriculture
- Remote Sensing
Did you find this app useful?
16 votes with an average of 2.86
Datasets Used
Screenshots
Image